Clik here to view.

Confused? Check out the glossary here.
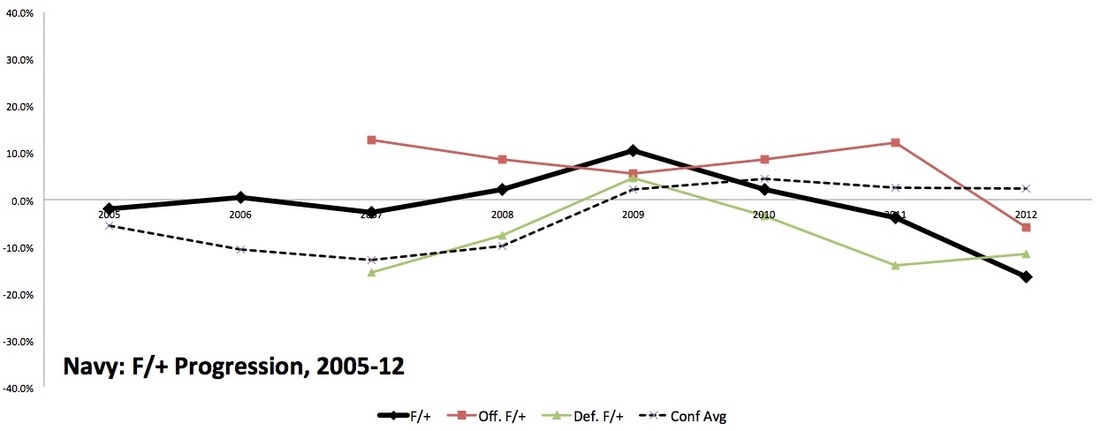
1. Back on track ... right?
Over the last two seasons, Navy has gone 6-5 in one-possession games and 7-7 in games decided by more than one possession. The Midshipmen's offense plummeted in 2012, from 19th in Off. F/+ in 2010 and 15th in 2011 to 87th. The defense, meanwhile, remained bad. In all, Navy regressed on paper for the third straight year, something about which head coach Ken Niumatalolo should be quite concerned. But that's not necessarily the story line.
In theory, Navy should have had about a .500 record in each of the last two years. But because of the distribution of those close games -- Navy went 2-5 in one-possession games in 2011 and 4-0 in 2012 -- it appears that there was quite a stumble in 2011 (to 5-7) and a lovely bounce back last year (to 8-5). Navy beat Army for the 11th straight year in 2012, won six of seven after switching quarterbacks, and put together another happy season, albeit one that ended with a massacre at the hands of Arizona State in the Fight Hunger Bowl.
Winning can beget more winning. Or it can simply foreshadow drastic regression toward the mean. Navy really wasn't very good in 2012 -- quite a bit worse than in 2011, actually -- and the defense hasn't had hope for a while. But close wins and an exciting young quarterback gave the Midshipmen hope regardless. Does the on-paper regression continue in 2013, or does Navy begin to become its 2012 record instead?
Clik here to view.
2012 Schedule & Results
| Record: 8-5 | Adj. Record: 4-9 | Final F/+ Rk: 97 | |||||
| Date | Opponent | Score | W-L | Adj. Score | Adj. W-L |
| 1-Sep | vs. Notre Dame | 10-50 | L | 36.2 - 41.6 | L |
| 15-Sep | at Penn State | 7-34 | L | 25.6 - 41.2 | L |
| 22-Sep | VMI | 41-3 | W | 29.2 - 27.7 | W |
| 29-Sep | San Jose State | 0-12 | L | 9.2 - 25.4 | L |
| 6-Oct | at Air Force | 28-21 | W | 31.4 - 36.9 | L |
| 12-Oct | at Central Michigan | 31-13 | W | 26.0 - 22.2 | W |
| 20-Oct | Indiana | 31-30 | W | 23.9 - 35.3 | L |
| 27-Oct | at East Carolina | 56-28 | W | 48.4 - 30.2 | W |
| 3-Nov | Florida Atlantic | 24-17 | W | 29.9 - 33.1 | L |
| 10-Nov | at Troy | 31-41 | L | 35.4 - 41.5 | L |
| 17-Nov | Texas State | 21-10 | W | 28.2 - 23.3 | W |
| 8-Dec | vs. Navy | 17-13 | W | 23.1 - 27.9 | L |
| 29-Dec | Arizona State | 28-62 | L | 34.3 - 52.3 | L |
| Category | Offense | Rk | Defense | Rk |
| Points Per Game | 25.7 | 83 | 26.8 | 55 |
| Adj. Points Per Game | 29.8 | 55 | 34.2 | 110 |
2. Keenan Reynolds made a difference
For the season as a whole, Navy's offense really wasn't very good. Not only did Navy rank outside of the Off. F/+ Top 40 for the first time in the last six seasons, but it finished way out: 87th. That said, the defense was still the primary culprit for any on-field struggle, and the offense did improve by quite a bit over the last eight games.
After bits of playing time here and there (13 passes, 17 rushes), true freshman Keenan Reynolds took over behind center following what was a pretty decent offensive performance against Air Force. Against CMU, he completed six passes for 134 yards and three touchdowns while grinding away on the ground; three games later, he rushed for 159 yards and a score and threw for 147 yards and two scores in a tight win over Florida Atlantic. Reynolds showed balance, poise, and solid control of an offense that hinges on quarterback play as much as any in the country. And despite his youth, he improved Navy's output by about five (adjusted) points.
Adj. Points Per Game (first 5 games): Opponent 34.6, Navy 26.3 (minus-8.3)
Adj. Points Per Game (last 8 games): Opponent 33.3, Navy 31.2 (minus-2.1)
Reynolds' emergence has created two conflicting narratives for Navy, really. He allows us to assume that the offense is in good hands for years to come. But he can't play defense.
Offense
Clik here to view.
| Category | Yards/ Game Rk | S&P+ Rk | Success Rt. Rk | PPP+ Rk |
| OVERALL | 78 | 61 | 39 | 78 |
| RUSHING | 6 | 49 | 27 | 60 |
| PASSING | 121 | 76 | 96 | 61 |
| Standard Downs | 50 | 21 | 75 | |
| Passing Downs | 90 | 99 | 81 | |
| Redzone | 32 | 34 | 33 |
| Q1 Rk | 95 | 1st Down Rk | 53 |
| Q2 Rk | 34 | 2nd Down Rk | 61 |
| Q3 Rk | 73 | 3rd Down Rk | 95 |
| Q4 Rk | 52 |
Quarterback
Note: players in bold below are 2013 returnees. Players in italics are questionable with injury/suspension.
| Player | Ht, Wt | 2013 Year | Rivals | Comp | Att | Yards | Comp Rate | TD | INT | Sacks | Sack Rate | Yards/ Att. |
| Keenan Reynolds | 5'11, 185 | So. | NR | 61 | 108 | 898 | 56.5% | 9 | 2 | 14 | 11.5% | 6.6 |
| Trey Miller | 6'0, 199 | Sr. | NR | 35 | 59 | 399 | 59.3% | 2 | 3 | 0 | 0.0% | 6.8 |
| John Hendrick | 6'1, 198 | Jr. | ** (5.2) | 2 | 3 | 32 | 66.7% | 0 | 0 | 0 | 0.0% | 10.7 |
| Kody Akers | 5'10, 201 | Jr. | NR |
Running Back
| Player | Pos. | Ht, Wt | 2013 Year | Rivals | Rushes | Yards | Yards/ Carry | Hlt Yds/ Carry | TD | Adj. POE |
| Noah Copeland | FB | 5'10, 214 | Jr. | NR | 140 | 644 | 4.6 | 2.3 | 5 | -10.3 |
| Keenan Reynolds | QB | 5'11, 185 | So. | NR | 134 | 699 | 5.2 | 5.7 | 10 | +1.1 |
| Gee Gee Greene | SB | 116 | 862 | 7.4 | 5.0 | 3 | +18.6 | |||
| Trey Miller | SB | 6'0, 199 | Sr. | NR | 80 | 358 | 4.5 | 3.6 | 3 | -0.4 |
| Bo Snelson | SB | 42 | 273 | 6.5 | 3.9 | 0 | -0.4 | |||
| Prentice Christian | FB | 34 | 160 | 4.7 | 3.2 | 1 | -0.1 | |||
| Darius Staten | SB | 5'6, 190 | Sr. | NR | 21 | 184 | 8.8 | 4.8 | 1 | +7.0 |
| Chris Swain | FB | 5'11, 232 | So. | NR | 14 | 148 | 10.6 | 8.8 | 1 | +6.4 |
| Colin Osborne | SB | 5'9, 206 | So. | ** (5.2) | ||||||
| Demond Brown | SB | 5'9, 191 | So. | ** (5.2) |
3. I have a theory
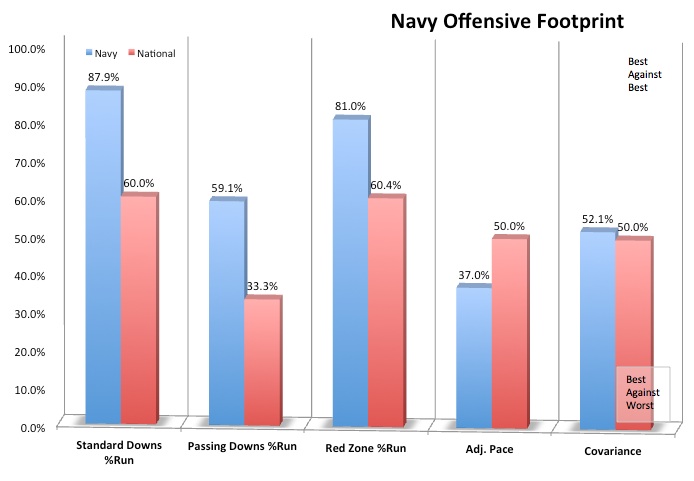
I think the slot back position is the single easiest in college football. Now, "easiest in college football" is not the same as just easy; you still take a lot of hits (in practice and in games), and you have to show good hands (especially in Navy's offense, where slot backs see almost as many targets as wideouts). And it probably goes without saying that you need to be faster than, say, me. Football is difficult at any position; but the slot back might be more easily replaceable than other positions.
The Flexbone offense, particularly Navy's, is set up to pound away with the fullback and quarterback (Navy quarterbacks and fullbacks averaged 31 carries per game in 2012), three to five yards at a time. They want to suck you into defending the middle, and they are just good enough at moving the chains to pull it off. And when you do get wrong-footed, the quarterback pitches wide to the slot back, who races to the corner for an easy seven yards, or 12, or 25. Death by a thousand cuts, followed by a huge slice.
Even last year, as Navy put together its worst advanced offensive numbers in years, it still had a perfectly efficient offense. The big plays were a little harder to come by, and the passing game could have used fewer negative plays, but the "thousand cuts" part of the equation was still there. And with the return of Reynolds and fullback Noah Copeland, we can probably expect more of the same. Copeland's numbers were far from impressive, really, but they didn't really need to be. They had to be just good enough to eventually suck the defense in, and they met that baseline. That Reynolds actually showed solid open-field explosiveness helped.
If my theory holds true, then Navy might not miss Gee Gee Greene all that much. As long as replacements like converted quarterback Trey Miller and sophomores Colin Osborne and Demond Brown have enough speed to exploit the free yards that they are given, Navy's run game will be fine. That said ... Greene did have some serious speed. More than any recent Navy slot back, Greene was able to not only accept the free yardage but burst out for more. Navy cannot afford to lose much of the explosiveness it did have last year, so easy or not, the slot back position will need to come through.
Receiving Corps
| Player | Pos. | Ht, Wt | 2013 Year | Rivals | Targets | Catches | Yards | Catch Rate | Yds/ Target | Target Rate | %SD | Real Yds/ Target | RYPR |
| Gee Gee Greene | SB | 32 | 18 | 309 | 56.3% | 9.7 | 19.9% | 53.6% | 10.9 | 41.3 | |||
| Brandon Turner | WR | 29 | 22 | 321 | 75.9% | 11.1 | 18.0% | 42.9% | 9.8 | 39.3 | |||
| Shawn Lynch | WR | 6'0, 190 | Sr. | NR | 27 | 14 | 286 | 51.9% | 10.6 | 16.8% | 42.3% | 12.2 | 38.6 |
| Casey Bolena | WR | 6'2, 210 | Sr. | NR | 21 | 13 | 146 | 61.9% | 7.0 | 13.0% | 65.0% | 6.9 | 21.1 |
| Noah Copeland | FB | 5'10, 214 | Jr. | NR | 16 | 12 | 91 | 75.0% | 5.7 | 9.9% | 33.3% | 4.9 | 13.1 |
| Bo Snelson | SB | 13 | 5 | 81 | 38.5% | 6.2 | 8.1% | 81.8% | 7.1 | 9.4 | |||
| Matt Aiken | WR | 6'0, 195 | Sr. | NR | 10 | 7 | 61 | 70.0% | 6.1 | 6.2% | 85.7% | 9.4 | 7.1 |
| Darius Staten | SB | 5'6, 190 | Sr. | NR | 6 | 1 | 7 | 16.7% | 1.2 | 3.7% | 80.0% | 1.1 | 1.0 |
| Geoffrey Whiteside | SB | 5'10, 171 | Jr. | NR | 4 | 4 | 35 | 100.0% | 8.8 | 2.5% | 50.0% | 13.7 | 3.5 |
| Ryan Williams-Jenkins | SB | 5'8, 170 | Jr. | ** (5.2) | 1 | 1 | 22 | 100.0% | 22.0 | 0.7% | 100.0% | 13.3 | 3.2 |
| John Howell | SB | 1 | 1 | 9 | 100.0% | 9.0 | 0.7% | 100.0% | 5.4 | 1.3 | |||
| Thomas Wilson | WR | 6'0, 192 | So. | NR | |||||||||
| Brandon Dudeck | WR | 6'0, 202 | Jr. | *** (5.5) | |||||||||
| Greg Bryant | WR | 6'2, 206 | Jr. | NR | |||||||||
| Jamir Tillman | WR | 6'3, 191 | Fr. | *** (5.5) | |||||||||
| Chandler Powell | WR | 6'0, 173 | Fr. | ** (5.4) |
4. A not-altogether-awful passing game
For the second straight season, Navy ranked 76th in Passing S&P+. That isn't great, but it is probably acceptable for this offense. But with Reynolds at quarterback, the Midshipmen sacrificed some explosiveness for better efficiency; Navy's Passing PPP+ rank fell from 41st to 61st, but its Passing Success Rate+ rose from 111th to 96th. In Brandon Turner, the receiving corps had a truly efficient option, a guy who was able to combine a 76 percent catch rate with a healthy per-catch average of 14.6 yards. But both Turner and Greene, the leading receiver, are gone, and it will be interesting to see how roles change. The duo of big-play Shawn Lynch and possession guy Casey Bolena might have some potential, but there are a few new names on the depth chart as well.
The biggest threat to Navy's efficiency, however, might not be Turner's absence; it could be sacks. Reynolds takes a lot of them, especially on passing downs. It's nice that he wants to make plays and is willing to take hits, but it's detrimental to a field position battle that means a ton to a team like Navy.
Offensive Line
| Category | Adj. Line Yds | Std. Downs LY/carry | Pass. Downs LY/carry | Opp. Rate | Power Success Rate | Stuff Rate | Adj. Sack Rate | Std. Downs Sack Rt. | Pass. Downs Sack Rt. |
| Team | 111.8 | 3.57 | 3.48 | 47.9% | 72.4% | 13.6% | 59.0 | 5.1% | 12.5% |
| Rank | 20 | 2 | 36 | 3 | 39 | 4 | 119 | 70 | 120 |
| Player | Pos. | Ht, Wt | 2013 Year | Rivals | Career Starts/Honors/Notes |
| John Cabral | LG | 38 career starts | |||
| Graham Vickers | RT | 6'1, 254 | Sr. | ** (5.3) | 15 career starts |
| Ryan Paulson | LT | 13 career starts | |||
| Jake Zuzek | RG | 6'0, 310 | Jr. | NR | 13 career starts |
| Tanner Fleming | C | 6'2, 276 | Jr. | ** (5.4) | 11 career starts |
| Andrew Barker | LT | 6 career starts | |||
| Bradyn Heap | RT | 6'3, 288 | Jr. | NR | 2 career starts |
| Thomas Stone | LG | 6'3, 295 | Sr. | ** (5.2) | 1 career start |
| Kahikolu Pescaia | C | ||||
| Matthew Van Halanger | RT | 6'3, 259 | Sr. | NR | |
| Chris Nurthen | RT | 6'3, 260 | Jr. | NR | |
| Joey Gaston | LT | 6'5, 281 | So. | ** (5.4) | |
| E.K. Binns | LG | 6'3, 287 | So. | ** (5.3) | |
| Brandon Greene | C | 6'3, 257 | So. | NR | |
| Ben Tamburello | RG | 6'2, 275 | So. | ** (5.4) |
5. Beware the cut block
At both the college and pro levels, we've heard a lot in recent years about the cut block, its danger, and the efforts to eradicate it from the game. No team in the country is better at the cut block than Navy, a team that ranked in the Adj. Line Yards top 20, created opportunities for its runners and avoided negative plays on the ground as well as any in the country; the cut block uses a defense's size against it, and when you've got players like Graham Vickers, a 254-pound right tackle, you aren't going to be able to simply out-girth many defenses. Plus, when defenders are paranoid about blockers diving at their feet and upending them, they tend to play more hesitantly. It's obvious why a team like Navy would use such a tactic.
Significant rule changes in this regard would basically force Navy to go with more of the zone blocking that Air Force utilizes; it wouldn't be a death knell for the Flexbone offense, but it would initiate some serious change.
Regardless, the cut block is still legal in 2013, and Navy should still be really good at it. Three-year starting guard John Cabral is gone, but five players with starting experience return, including three full-time (or close to it) starters.
Defense
Clik here to view.

| Category | Yards/ Game Rk | S&P+ Rk | Success Rt. Rk | PPP+ Rk |
| OVERALL | 72 | 107 | 122 | 83 |
| RUSHING | 95 | 118 | 123 | 91 |
| PASSING | 40 | 93 | 117 | 79 |
| Standard Downs | 105 | 123 | 87 | |
| Passing Downs | 97 | 114 | 83 | |
| Redzone | 113 | 99 | 111 |
| Q1 Rk | 105 | 1st Down Rk | 109 |
| Q2 Rk | 118 | 2nd Down Rk | 120 |
| Q3 Rk | 97 | 3rd Down Rk | 64 |
| Q4 Rk | 104 |
6. Bend ... bend ... bend...
On Monday, we talked about Army's woeful defense, an aggressive unit that made some plays but got steamrolled by most of the teams it played, especially in the first two-thirds of the season. Navy's defense, on the other hand, was one of the most passive in the country. It was slightly more successful than Army's (or less unsuccessful, anyway), but in a desperate attempt to prevent big plays, Navy was a sieve up front, with the second-most inefficient run defense in the country and no major passing downs pass rush to get it out of jams (not that Navy actually forced many passing downs). It was a bend-don't-break defense that bent too much. And without its lone play-maker (linebacker Keegan Wetzel), Navy might be forced to attempt more of the same in 2013.
Not very long ago, by the way, all three service academies fielded defenses that were somewhere between competent and elite. In 2009, Air Force ranked 12th in Def. F/+, Navy ranked 35th, and Army ranked 54th. In 2012, they ranked 99th, 107th, and 124th, respectively. It is easy to point to a simple lack of size, talent, and athleticism as the cause for 2012's struggles; the service academies are always going to be undersized and athletically out-manned. But less than four years ago, all three teams had figured out ways not to stink on defense. We can explain part of that by pointing out that Air Force's defensive coordinator at the time was Tim DeRuyter, who has since proven his coaching mettle at Texas A&M (defensive coordinator) and Fresno State (head coach). And Navy's 2009 defense probably benefited from Ricky Dobbs' deft engineering of the offense; as a Missouri fan, I watched my team grow quickly desperate and take silly chances on offense as Dobbs pulled off six-minute drive after six-minute drive.
Still, that doesn't explain Army, which had a positively awful offense in 2009. And it doesn't change the fact that Navy's offense stayed strong in 2010 and 2011 while the defense fell off of a cliff. Was the 2009 season the outlier, or are we living through one right now? Is it possible for service academies, which will always be outmanned from a size-and-athleticism standpoint, to field a quality defense without a coordinator who will quickly leave them for a bigger job?
Defensive Line
| Category | Adj. Line Yds | Std. Downs LY/carry | Pass. Downs LY/carry | Opp. Rate | Power Success Rate | Stuff Rate | Adj. Sack Rate | Std. Downs Sack Rt. | Pass. Downs Sack Rt. |
| Team | 83.9 | 3.50 | 3.43 | 47.2% | 67.9% | 15.0% | 78.2 | 3.6% | 5.2% |
| Rank | 118 | 122 | 84 | 123 | 61 | 112 | 97 | 99 | 86 |
| Name | Pos | Ht, Wt | 2013 Year | Rivals | GP | Tackles | % of Team | TFL | Sacks | Int | PBU | FF | FR |
| Wes Henderson | DE | 13 | 31.0 | 4.2% | 5 | 3.5 | 0 | 3 | 1 | 0 | |||
| Evan Palelei | DE | 6'3, 247 | Sr. | *** (5.6) | 13 | 23.5 | 3.2% | 1.5 | 0.5 | 0 | 1 | 2 | 0 |
| Barry Dabney | NG | 6'1, 302 | Sr. | ** (5.2) | 13 | 14.0 | 1.9% | 0 | 0 | 0 | 0 | 0 | 1 |
| Danny Ring | NG | 6'2, 260 | Jr. | ** (5.0) | 13 | 13.0 | 1.8% | 2 | 1 | 0 | 0 | 0 | 0 |
| Paul Quessenberry | DE | 6'2, 251 | Jr. | NR | 13 | 11.5 | 1.6% | 1.5 | 1 | 0 | 0 | 0 | 0 |
| Josh Dowling-Fitzpatrick | DE | 10 | 9.5 | 1.3% | 2.5 | 0 | 0 | 0 | 0 | 0 | |||
| Travis Bridges | NG | 6'0, 318 | Sr. | NR | 13 | 8.5 | 1.2% | 0 | 0 | 0 | 0 | 0 | 0 |
| Collin Sturdivant | DE | 7 | 4.5 | 0.6% | 2 | 1 | 0 | 0 | 1 | 0 | |||
| Bernard Sarra | NG | 6'1, 303 | So. | ** (5.1) | 8 | 4.5 | 0.6% | 0 | 0 | 0 | 0 | 0 | 0 |
| Will Anthony | DE | 6'1, 238 | So. | ** (5.3) | 13 | 4.0 | 0.5% | 1 | 0 | 0 | 0 | 0 | 1 |
| Aaron Davis | DE | 6'0, 251 | Jr. | ** (5.2) | 11 | 2.0 | 0.3% | 0.5 | 0 | 0 | 0 | 0 | 1 |
| David Gordeuk | DE | 6'3, 236 | So. | NR | |||||||||
| Sean Spencer | DE | 6'4, 255 | Fr. | *** (5.6) | |||||||||
| Eli Dawson | DE | 6'5, 230 | Fr. | ** (5.4) | |||||||||
| Michael Raiford | NG | 6'6, 285 | Fr. | ** (5.4) |
Linebackers
| Name | Pos | Ht, Wt | 2013 Year | Rivals | GP | Tackles | % of Team | TFL | Sacks | Int | PBU | FF | FR |
| Matt Warrick | ILB | 13 | 69.5 | 9.4% | 4.5 | 0 | 3 | 3 | 0 | 0 | |||
| Keegan Wetzel | OLB | 13 | 62.0 | 8.4% | 15 | 7 | 0 | 1 | 1 | 1 | |||
| Brye French | ILB | 13 | 59.0 | 8.0% | 2 | 0 | 0 | 1 | 0 | 0 | |||
| Cody Peterson | ILB | 6'3, 228 | Sr. | NR | 13 | 47.5 | 6.5% | 2 | 0 | 0 | 0 | 1 | 0 |
| Jordan Drake | OLB | 6'4, 220 | Jr. | NR | 13 | 37.0 | 5.0% | 4.5 | 2 | 1 | 1 | 1 | 0 |
| Josh Tate | OLB | 5'11, 209 | Jr. | NR | 13 | 19.0 | 2.6% | 2.5 | 1 | 0 | 0 | 2 | 1 |
| Obi Uzoma | OLB | 6'3, 231 | Jr. | NR | 13 | 8.5 | 1.2% | 1.5 | 0 | 0 | 0 | 0 | 0 |
| James Britton | ILB | 6'2, 223 | Jr. | ** (5.4) | 13 | 4.5 | 0.6% | 0 | 0 | 0 | 0 | 0 | 1 |
| A.K. Akpunku | OLB | 6'3, 238 | So. | ** (5.3) | 9 | 1.5 | 0.2% | 0 | 0 | 0 | 0 | 0 | 0 |
| Vinnie Mauro | ILB | 6'2, 231 | Sr. | *** (5.5) | |||||||||
| Anthony Lewis | ILB | 6'0, 229 | Jr. | *** (5.6) | |||||||||
| Maika Polamalu | ILB | 6'0, 218 | Jr. | *** (5.5) | |||||||||
| Chris Johnson | OLB | 6'1, 207 | Jr. | NR | |||||||||
| Nathaniel Ozdemir | LB | 6'2, 225 | Fr. | ** (5.4) | |||||||||
| Colton Jumper | LB | 6'2, 218 | Fr. | ** (5.4) | |||||||||
| Mike Kelly | LB | 6'1, 210 | Fr. | ** (5.4) |
7. New blood at linebacker
To the extent that there were stars on the Navy defense last year, the first two on the list probably had to be Keegan Wetzel and Matt Warrick, both of whom are now gone. In their place is a depth chart full of potential and minimal known productivity. Jordan Drake and Josh Tate combined for seven tackles for loss among their 56.0 tackles, and three former three-star recruits could be part of the rotation. And depending on which of the three high-two-star recruits makes it to Annapolis and stays, there could be a nice youth boost as well. The ceiling for this unit might actually be pretty high, but considering how productive Wetzel in particular was last year (he alone accounted for nearly one-third of Navy's TFLs), the young guys will certainly need to produce pretty quickly.
Secondary
| Name | Pos | Ht, Wt | 2013 Year | Rivals | GP | Tackles | % of Team | TFL | Sacks | Int | PBU | FF | FR |
| Tra'ves Bush | ROV | 13 | 68.5 | 9.3% | 1 | 0 | 0 | 5 | 1 | 1 | |||
| Parrish Gaines | CB | 6'2, 196 | Jr. | ** (5.2) | 13 | 55.5 | 7.5% | 2 | 0 | 2 | 2 | 0 | 0 |
| Wave Ryder | ROV | 6'2, 207 | Sr. | ** (5.4) | 13 | 40.5 | 5.5% | 0 | 0 | 1 | 0 | 0 | 0 |
| Kwazel Bertrand | CB | 5'10, 186 | So. | NR | 12 | 32.0 | 4.4% | 2 | 1 | 0 | 4 | 0 | 1 |
| Chris Ferguson | FS | 6'2, 195 | Jr. | NR | 9 | 29.0 | 3.9% | 0 | 0 | 0 | 0 | 1 | 0 |
| Quincy Adams | CB | 5'11, 195 | So. | NR | 10 | 23.0 | 3.1% | 1 | 0 | 1 | 4 | 0 | 1 |
| Jonathan Wev | CB | 2 | 3.0 | 0.4% | 0 | 0 | 0 | 0 | 0 | 0 | |||
| Mike Markovsky | FS | 6'1, 191 | So. | ** (5.4) | 7 | 2.5 | 0.3% | 0 | 0 | 0 | 0 | 0 | 0 |
| Myer Krah | CB | 5'11, 203 | So. | ** (5.4) | 5 | 2.0 | 0.3% | 0 | 0 | 0 | 0 | 0 | 0 |
| George Jamison | ROV | 6'0, 197 | Jr. | NR | 5 | 2.0 | 0.3% | 0 | 0 | 0 | 0 | 0 | 0 |
| Shelley White | CB | 5'10, 190 | So. | ** (5.3) | |||||||||
| Eric Johnson | CB | 5'10, 191 | Jr. | NR | |||||||||
| Lorentez Barbour | ROV | 6'1, 195 | So. | NR |
Special Teams
| Punter | Ht, Wt | 2013 Year | Punts | Avg | TB | FC | I20 | FC/I20 Ratio |
| Pablo Beltran | 6'2, 225 | Jr. | 44 | 43.6 | 6 | 15 | 18 | 75.0% |
| Kicker | Ht, Wt | 2013 Year | Kickoffs | Avg | TB | TB% |
| Colin Amerau | 6'2, 195 | Jr. | 63 | 60.7 | 19 | 30.2% |
| Place-Kicker | Ht, Wt | 2013 Year | PAT | FG (0-39) | Pct | FG (40+) | Pct |
| Nick Sloan | 6'0, 190 | So. | 41-41 | 9-12 | 75.0% | 1-3 | 33.3% |
| Returner | Pos. | Ht, Wt | 2013 Year | Returns | Avg. | TD |
| Marcus Thomas | KR | 5'7, 165 | Sr. | 21 | 23.0 | 0 |
| Ryan Williams | KR | 5'8, 170 | Jr. | 10 | 22.3 | 0 |
| Gee Gee Greene | KR | 6 | 31.2 | 1 | ||
| Shawn Lynch | PR | 6'0, 190 | Sr. | 11 | 9.4 | 0 |
| Category | Rk |
| Special Teams F/+ | 43 |
| Net Punting | 43 |
| Net Kickoffs | 88 |
| Touchback Pct | 79 |
| Field Goal Pct | 75 |
| Kick Returns Avg | 29 |
| Punt Returns Avg | 64 |
8. A solid punter
Sacks hurt Navy in the field position department, to an extent; but a) we're still talking about a small number of sacks here (because we're still talking about a small number of passes), and b) Navy still finished a healthy 61st in Field Position Advantage, in part, because of quality kick returns and a hell of a punter in Pablo Beltran. Gee Gee Greene was probably the best kick returner, but he only returned six of them; the two leaders in that department are back, as is Beltran. This is a good thing. though one does wonder if Beltran could do a little better in the kickoffs department than Colin Amerau.
2013 Schedule & Projection Factors
| 2013 Schedule | ||
| Date | Opponent | Proj. Rk |
| 7-Sep | at Indiana | 70 |
| 14-Sep | Delware | NR |
| 28-Sep | at Western Kentucky | 94 |
| 5-Oct | Air Force | 91 |
| 12-Oct | at Duke | 77 |
| 19-Oct | at Toledo | 62 |
| 26-Oct | Pittsburgh | 31 |
| 2-Nov | at Notre Dame | 8 |
| 9-Nov | Hawaii | 100 |
| 16-Nov | South Alabama | 119 |
| 22-Nov | at San Jose State | 72 |
| 14-Dec | vs. Army | 103 |
| Five-Year F/+ Rk | 60 |
| Two-Year Recruiting Rk | 110 |
| TO Margin/Adj. TO Margin* | 0 / +3.5 |
| TO Luck/Game | -1.4 |
| Approx. Ret. Starters (Off. / Def.) | 14 (8, 6) |
| Yds/Pt Margin** | -0.4 |
9. This is pretty fun
Pardon me while I put on a football helmet and run through a wall.
10. 12 straight?
The goals for Navy in a given season do not, of course, include putting together a quality F/+ rating. (That's good, because they haven't for a couple of years now.) They are, probably in order, to beat Army and to overcome size/speed disadvantages enough to reach a bowl game. In that sense, Navy has met both criteria in nine of the last 11 years and met one of two in the other two.
This program has come a long way since it was going 3-30 from 2000-'02. The margin for error has shrunk as the team has regressed, and the Midshipmen did need a late fumble recovery to win their 11th straight over Army last December (and some close-games luck to make a bowl).
But the offense will have an exciting face (Keenan Reynolds') for the next three years, and while the schedule is rather daunting in spots (at least, for a team that might struggle to crack the F/+ Top 90), I'm going to assume that Navy makes another bowl, if just barely, in 2013. But to get to six wins, the Midshipmen might very well need to win a 12th straight Army game. You know, in case the stakes for that game needed to be raised any higher.
More from SB Nation:
Follow @SBNationCFB Follow @SBNRecruiting• When the SEC’s seven-year streak could’ve ended
• EDSBS: Get yourself a field like Wyoming’s
• Nick Saban doesn’t have time for Bob Stoops’ s---
• Be careful with the USA Today college sports revenue database